
Performance
As each client has a unique requirement, and therefore invest using different model portfolios, or a mix of models, and also having started their investing at different times it would be inaccurate to show an amalgamated total return for these clients. Therefore, in order to see how your possible portfolio may have performed I have produced some graphs showing the Total Returns of our Model Portfolios from the time they were setup. It includes the changes to the models as time progresses.
Notes
- The FTSE All-Share index and the model portfolios show dividends reinvested.
- Fees are not included in either the index or the portfolios.
- The Income models (SEI) show the price since it is planned that the income is paid out to the client, and the total return line shows the dividends being reinvested. Currently (31/12/2022) the SEI 20 pays out 6.2% net of fees, and SEI 10 pays out 6.75%, the FTSE All-Share is 3.6%.
The Growth Model (G3)

Total Return since inception of model in April 2010
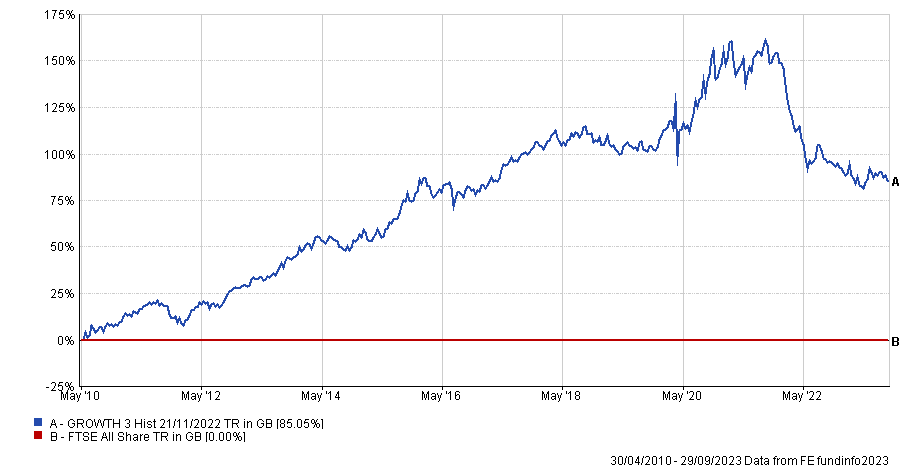
Relative to the FTSE All-Share
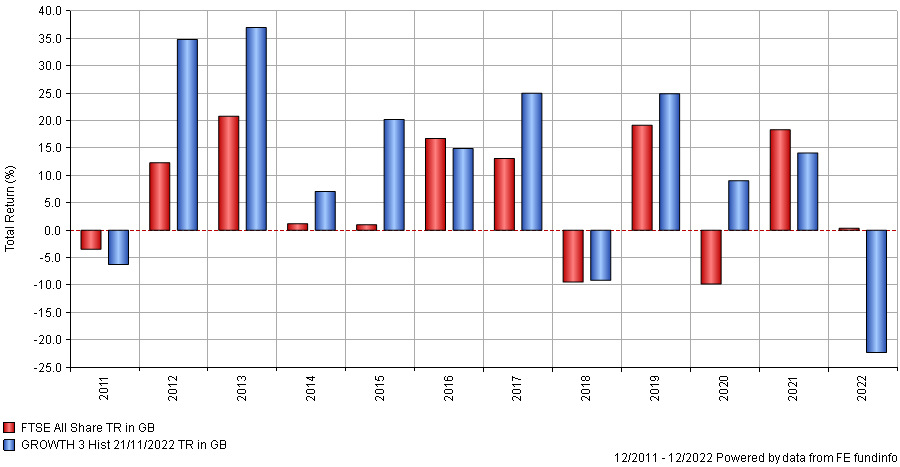
Discrete Performance
The Defensive Model (D7)

Total Return since inception of model in March 2007

Relative to the FTSE All-Share
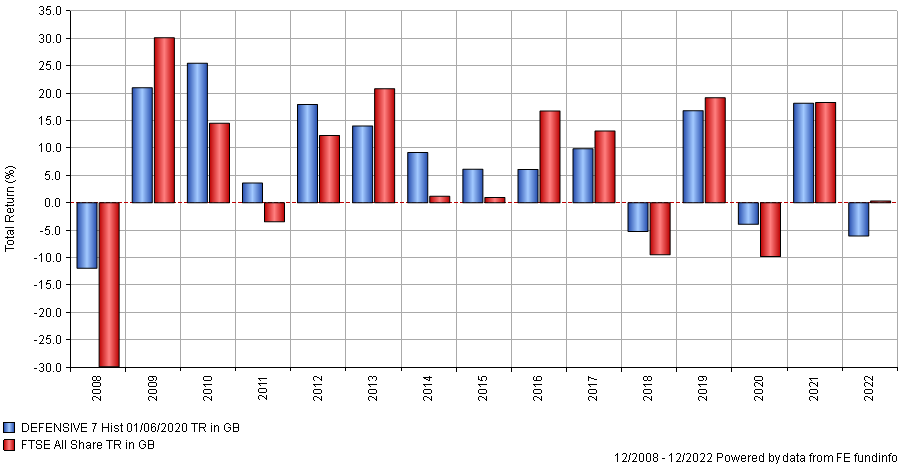
Discrete Performance
The Income Model (SEI 20)
Price Performance since inception of model in August 2010. Since income is paid out it is unrealistic to show dividends reinvested (Total Return).


Relative to the FTSE All-Share
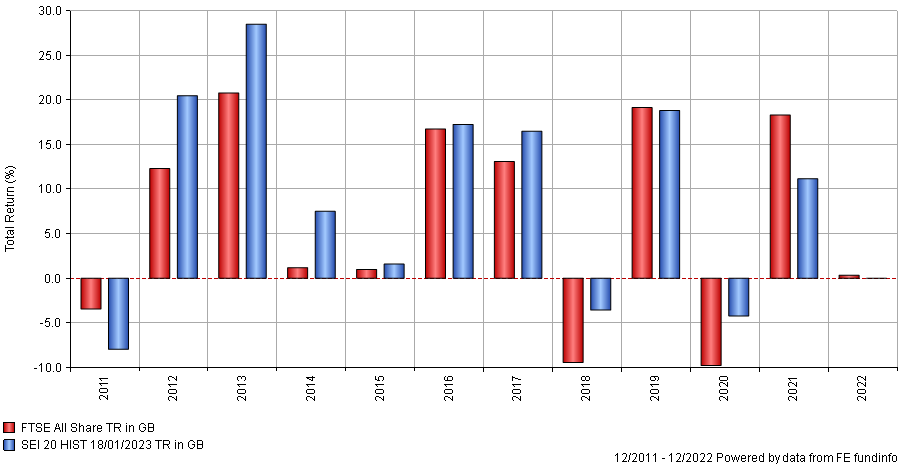
Discrete Performance (includes dividends)